
My Cart (0 )
- Uncategorized
- April 29, 2020
Patrick Kargbo
Post-distribution Livelihood Analysis of Landslide Emergency Response in Sierra Leone
By
Patrick kargbo
Abstract
The study was to assess post-distribution livelihood analysis on landslide emergency response in Sierra Leone, with the following are the objectives of the post-distribution monitoring survey to describe the characteristics of the household head, Situation of children in the household, The rate at which the household head shelter was destroyed, Household head livelihoods and The feedbacks from the household heads towards the project. The sample size for this study was determined based on Yamane (1967) sample size determination procedure. Using this procedure, a total of 150 household head was selected from the total population. The sample was randomly selected for the survey. After cleaning the data at a 5% degree of accuracy/margin of error 132 was analyzed. Based on the findings of the study, the following conclusions are drawn: the study reveals that Female households dominate as the most vulnerable people in the study area, indicating that women play essential rule in the sustainability of the house. The majority of the household head were within the age bracket of 25 to 59 years, stating that there are more active members engaged in supporting the livelihood for each household. It also stated clearly that most of the household was led by a single woman and the situation of children in the household categorical sate that for the school level most of the children are in have a primary school and in good health condition they also need protection. The data also stated clearly that all the targeted beneficiaries were affected by the flood/landslide and their properties are destroyed. The data also shows that before the landslide they have income-generating activities but now it was destroyed activity. Majority of the household head know what is child protection and most of them stated that the major risks their children are currently facing are economic exploitation
Keywords: livelihood, distribution, landslide, emergency, responds
Introduction
On 14th August 2017 Sierra Leone Capital City Freetown expérience one of the most recent heavy rainfall. Three days of heavy rains triggered flash floods and a massive landslide in and around the capital Freetown, Sierra leone. The most severe disaster occurred in Regent and Lumley community with a massive 6 kilometers mudslide submerging and wiping out over 300 houses along the banks of the Juba River. Flash floods also affected at least four other communities in other parts of Freetown.
The UNDAC situation update as of August 25th reported a total of 496 fatalities and roughly 800 missing persons. The Office of National Security (ONS) the organization in charge of the coordination of the humanitarian response, list 5962 individuals (1424 households) in five communities as being directly affected by flood or landslide affected areas, referring to the following categorization:
- Survivors whose homes have been rendered either temporarily or permanently uninhabitable
- Households who have lost income generating member(s)
Research Objectives
The following are the objectives of the post-distribution monitoring survey
- To describe the characteristics of the household head
- The situation of children in the household
- The rate at which the household head shelter was destroyed
- Household head livelihoods
- The feedbacks from the household heads towards the project
Methodology
Sample
The sample size for this study was determined to base on Yamane’s (1967) sample size determination procedure. Using this procedure, a total of 150 household head was selected from the total population. The sample was randomly selected for the survey. After cleaning the data at 5% degree of accuracy/margin of error 132 was analyzed
Data collection, entry and analysis
A survey questionnaire was developed. The Survey questionnaire was chosen for the collection of information from the household heads to achieve the objectives. The preferred questionnaire because of the ease of administration and scoring. Four enumerators were hired to conduct the Survey when the 200 household heads came to collect their packages. The enumerators were trained and how to interpret the tool. The data collected was clean, entered, and analyzed by simple descriptive analysis and econometric models using statistical package for social scientist (SPSS) version 16 soft were. The software was chosen because it is the most used package for analyzing Survey data. The software has the following advantages: It can easily be used to analyze multiple-response questions, cross-section and time series analysis, and cross-tabulations (i.e. relate two sets of variables) and it can also be used alongside Microsoft Excel.
Descriptive statistics such as frequency counts, percentages, proportions, and means were used to analyze the data. Frequency tables were developed to display the results obtained from the research analysis
Limits and Challenges
There were limitations encountered during the study. These were:
Respondent was not will to divulge information: some respondent is reluctant to respond to the interview schedule because a lot of their time had been wasted in the past by researchers on interviews without any perceived benefits.
Getting respondents for questioning it was also difficult to get the respondent to spear their productive time or leisure time for questioning. They were either very busy looking out for more support from other N donors or people. This, therefore, put heavy pressure on data collection to approximately adjust to the respondents’ daily schedule and interviews them when it was convenient.
The result of the study is presented and discussed .the interpretation is based on the set objectives for the cash transfer. Finding were also explained in the context of related studies.
1.1 Information on the head of household
One of the objectives of the study was to determine the characteristics of households in juba community
Gender of respondents
Gender may determine what role and woman play in the development programs in the household. Hence, the gender situation in the study area was investigated and results are presented below.
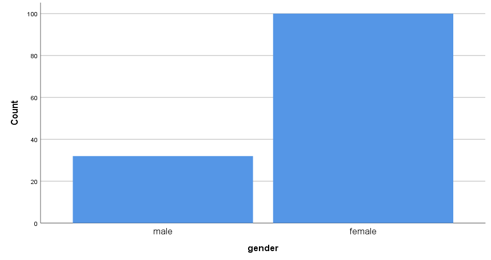
Figure 1: Showing Gender distribution of respondents
Figure 1: shows that 75.8% of the respondent interviewed were female and 24.2% were male .this reveals that in the study area, the female gender is the highest participants in the household
Age of Respondent Age is a measure of maturity and determines the rate of an individual in any society. Literature tends to suggest that it also determines the adoption capacity of the individual age distribution of respondent ise
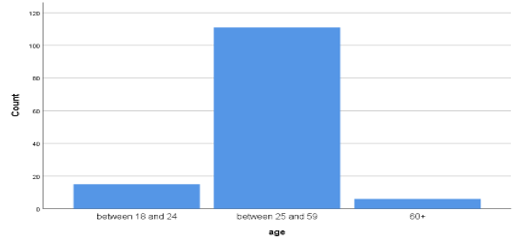
Figure 2: Distribution of respondents in the study area
Figure 2: shows that the age varies from 18 and 78 years, 11.4% are between 18 and 24,25 and 59 are 84.1% and 60+ is 4.5%.it is clearing show that the household heads were in the middle age class. This has a positive bearing on their ability to sustain their livelihood.
Type of household
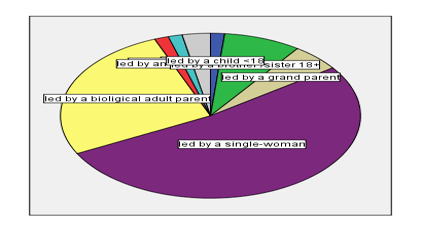
Figure 3: type of household
Figure 3: among the respondent that were interviewed 52.3% were household lead by a single woman and 47.7% could either be led by a child (<18), led by a brother /sister 18+, led by a grandparent, led by a single-woman, led by a biological adult parent, led by an uncle/auntie, led by a foster parent and if other (specify).
Number of adults in the household
Figure 4: showing the number of adult in the household
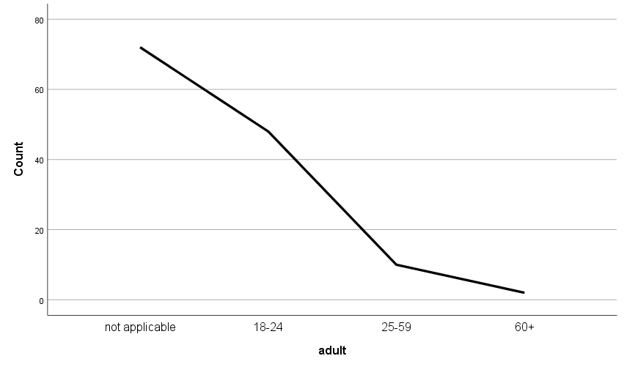
Figure 4: shows that 36.4% of the respondents had adults between 18-24 years household members with the highest majority, 7.6% of the respondents had 25-59 years household members with the second majority, 1.5% of the respondents had 60+ and 54.5% said they do not have Adult in their household.
1.2 situation of children in the household
The situation of children in the household school level
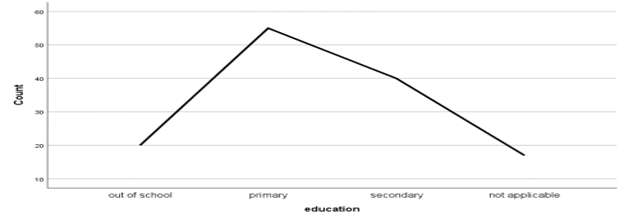
Figure 5: showing the situation of children in the household school level
Figure 5 shows that 41.7% of the respondent interviewed said that their children are in the primary school, 30.3% in the secondary school, 15.2% out of school and 12.9 is not applicable
Health Situation of children in the household
Figure 6: showing the health situation of children in the household
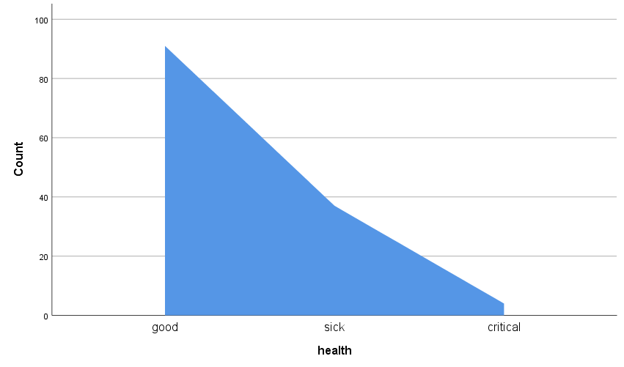
Figure 6: showing the health situation of children in the household
Figure 6: show that 68.9% of the respondent interviewed said that their children are in good health condition, 28.0% sick, and 3.0% in a critical situation
Need for protection of children in the household
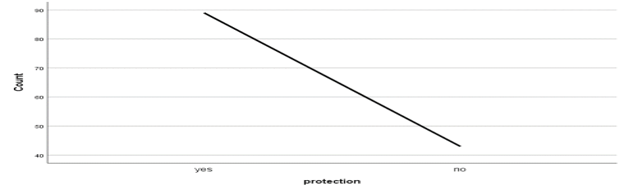
Figure 7: the need for protection of children in the household
Figure 7: show that 67.4% of the respondent interviewed said yes there is a need for child protection and 32.6% said No there is no need for child protection
1.3 Shelter
House has been affected by flood/ the landslide

Figure 8: Showing how the house been affected by the flood /the landslide
Figure 8: show that all the respondent have been affected by the flooding /landslide
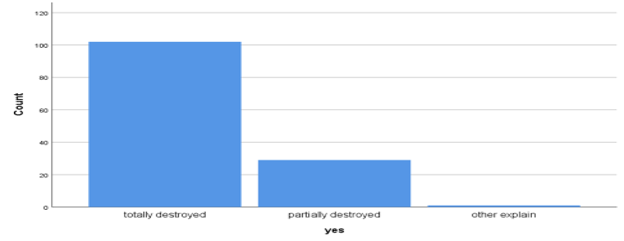
Figure 9: showing they answer yes and how much it been affected
Figure 9: show that 77.3% of the respondent said they are total destroyed, 22.0% of the respondent said they are partially destroyed and 8% said they do not know1.4 Livelihood
1.4 Livelihood
Income-generating activity before the landslide
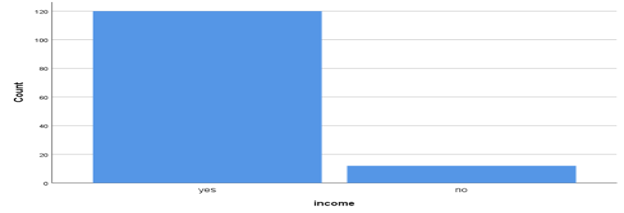
Figure 10: showing income-generating activity before the landslide
Figure 10: shows that 90.9% of the respondent interviewed say Yes they have an income-generating activity before the landslide and 9.1% of the respondent interviewed say No they have not had an income-generating activity before the landslide.
If yes, how much has it been affected by the landslide
Figure 11: showing that yes it has been affected by the landslide
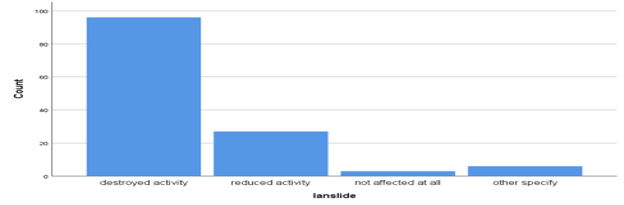
Figure 11: the data clearly show that 72.7% of the respondent income-generating activity is destroyed activity, 20.5% of the respondent reduced activity, 2.3% of the respondent not affected at all and 4.5% of the respondent said they do not know
How do you cope if your income generating activity has been completely or partially destroyed?
Figure 12: showing they cope if your income generating activity has been completely or partially destroyed?
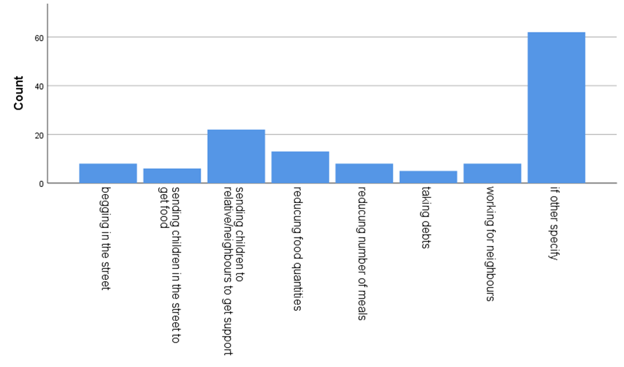
Figure 12: shows that 47% of the respondent interview doing business(if other specify),6.1% working for neighbors,3.8% taking debts,6.1% reducing number of meals,9.8% reducing food quantities,16.7% sending children to relatives/neighbors to get support,4.5% sending children in the street to get food and 6% begging in the street
How much revenue did you make with your income-generating activity (if any) in the last days?
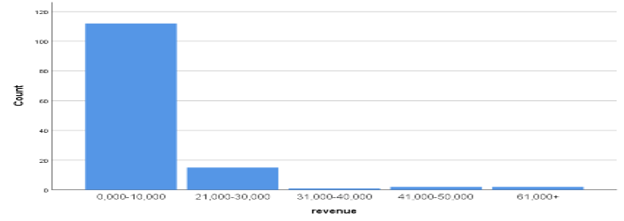
Figure 13: showing the revenue make with income-generating activity
Figure13: the data clearly show that 84.8% of the respondent weekly revenue is between 0,000-10,000 leone.11.4% of the respondent weekly revenue is between 21,000-30,000 Leone, 8% of the respondent weekly revenue is between 31,000- 40,000leone, 1.5% of the respondent weekly revenue is between 41,000-50,000leone and 1.5% of the respondent weekly revenue is 61,000 Leone
Figure 13: showing the revenue make with income-generating activity
How well can you currently cover the essential needs of the household?
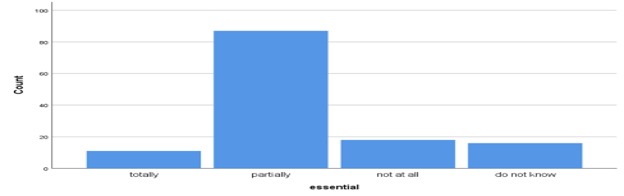
Figure14: showing how well can they currently cover the essential needs of the household
Figure14: the data clearly show that 65.9% of the respondent cover their essential needs partially, 8.3% of the respondent cover their essential needs totally, 12.1% of the respondent does not know if their essential needs are cover and 13.6% respondent not at all.
Revenue expenditure
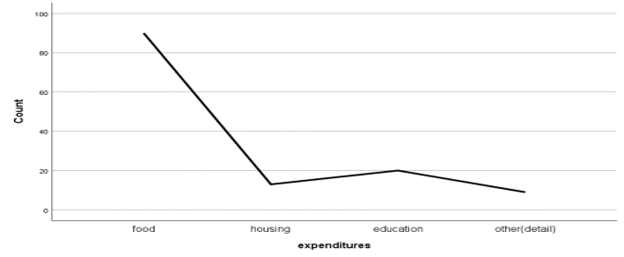
Figure15: showing the revenue expenditure
Figure15: show that 68.2% of the respondent interviewed spend their revenues on food, 9.8% of the respondent spend their revenue on housing, 15.2% of the respondent spend their revenue on education, 6.8% on other (business) the likes of health cloth and transportation nothing spent.
Prioritized of expenditure
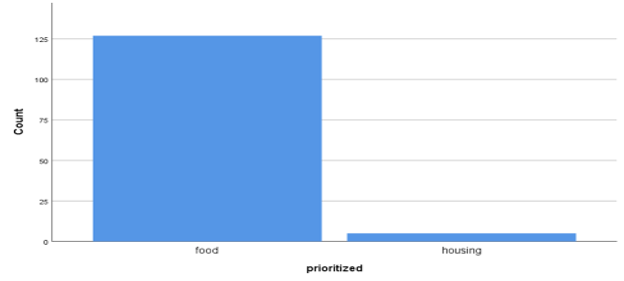
Figure16: prioritized revenue spend
Figure16: show that 96.2% of the respondent interview spend their rev3.8% on housing.
Received cash assistance
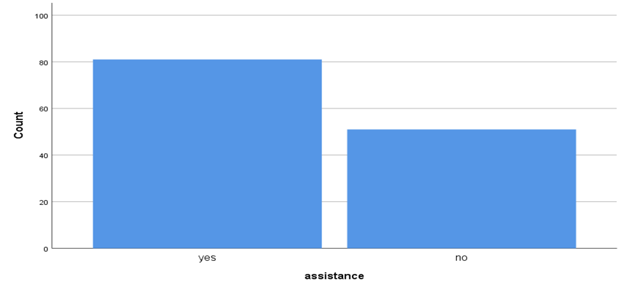
Figure17: showing if the received cash assistance since the landslide
Figure17: show that 61.4% of the respondent interviewed say yes they received cash assistance and 38.6% say no.
If yes, how many much have you received in total?
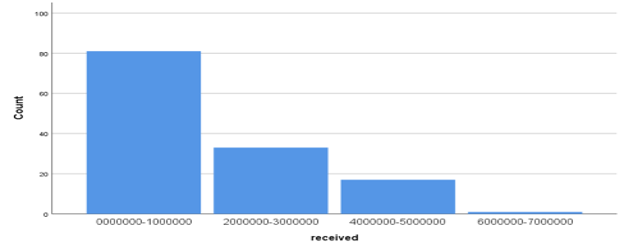
Figure 18: showing the amount of cash received
Figure 18: show that 61.4% of the respondent interviewed received cash between 0,000,000-1,000,000 Leone, 25.0% of the respondent received cash between 2,000,000-3,000,000 Leone, 12.9% of the respondent received between 4,000,000-5,000,000 Leone and 8% received 6,000,000-7,000,000 Leone.By which organization
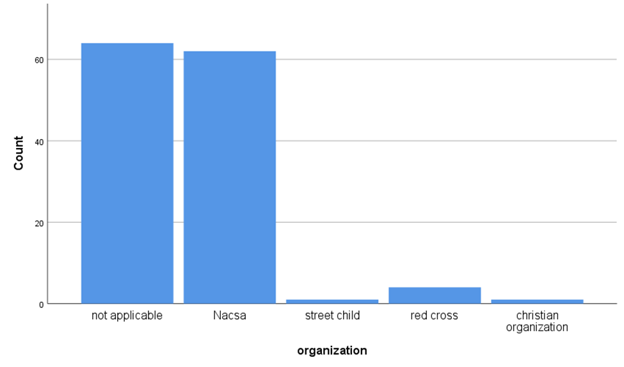
Figure 19: showing the organization that provides cash
Figure19: the data clearly show that 47.0% of the respondent received cash from NACSA, 8% from the street child, 8% from Christian organization and 48.5% show that it is not applicable
How did you use the cash received
Figure 20: showing how they used the cash received
Figure 20: shows that 21.2% of the respondent interviewed use their cash received on health issues, 18.2% on food,5.2% on housing, 3.8% on education, 6.1% on transportation and 31.8% on others ( business)
1.5 FOOD
How many meals a day households members have per day Adult
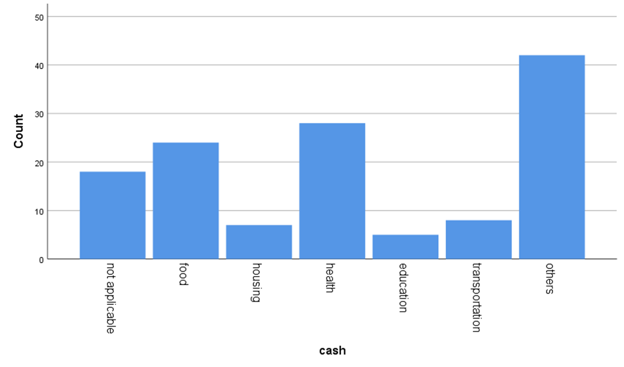
Figure 20: showing how they used the cash received
Figure 20: shows that 21.2% of the respondent interviewed use their cash received on health issues, 18.2% on food,5.2% on housing, 3.8% on education, 6.1% on transportation, and 31.8% on others ( business).
1.5 FOOD
How many meals a day households members have per day Adult
Figure21: showing the meal a day household member have per day Adult
Figure 21: shows that 38.6% of the respondent interviewed have 3 meals per day, 34.1% of the respondent interviewed received 2 meals per day, 25.0% received 1 meal per day and 2.3% received meal per day.
How many meals a day households members have per day children
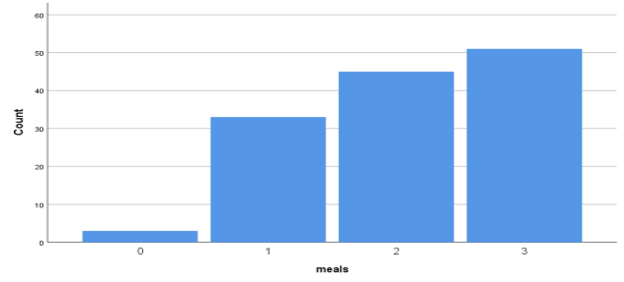
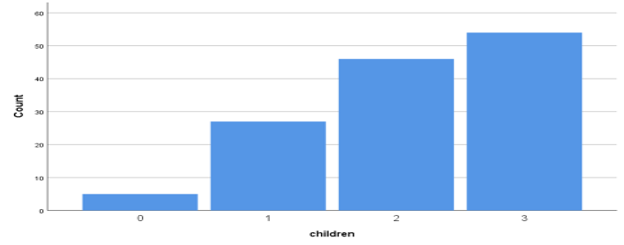
Figure22: showing the meal a day household member have per day child
Figure 21: show 40.9 of the respondent interviewed have 3 meals per day, 34.8% of the respondent interviewed received 2 meals per day, 20.5% received 1 meal per day, and 3.8% received meal per day.
1.6 Intentions
Do you intend to relocate with your household?
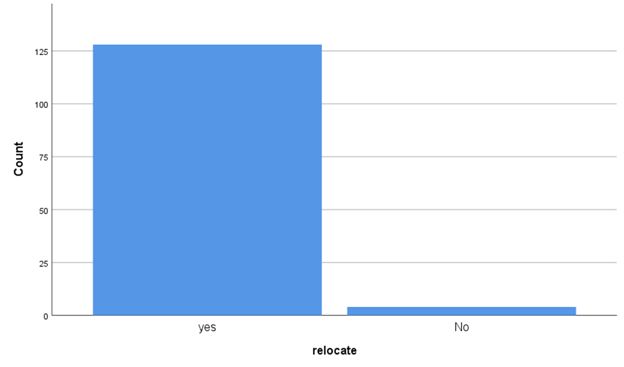
Figure 23: showing the intention to relocate with their household
Figure23: show that 97.0% of the respondent interviewed said yes they want to relocate and 3.0% said No
Why do they want to relocate?
Figure24: showing the reason why they want to move
Figure24: show that 59.8% of the respondent interviewed want to move because the place is not nice, 36.4% said the place is not safe, 8% ask by the government to relocate and 4% because of health reason
If yes, where
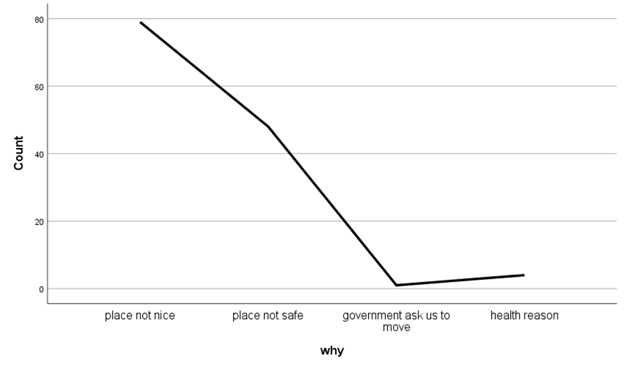
Figure24: showing the reason why they want to move
Figure24: show that 59.8% of the respondent interviewed want to move because the place is not nice, 36.4% said the place is not safe, 8% ask by the government to relocate and 4% because of health reason
If yes, where
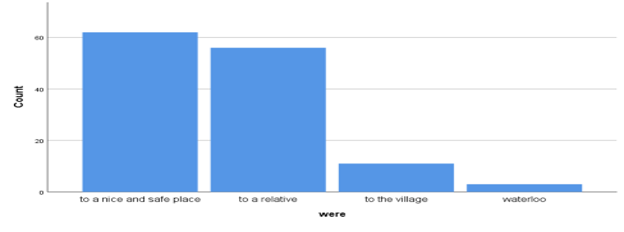
Figure 25 showing if they say yes where are they going
Figure25: the data clearly show that 47.0% of the respondent interview will be moving to a nice and safe place, 42.4% to a relative, 8.3% to the village and 2.3% to waterloo community
If you were to receive cash assistance, what would you use it for in priority for Adults?
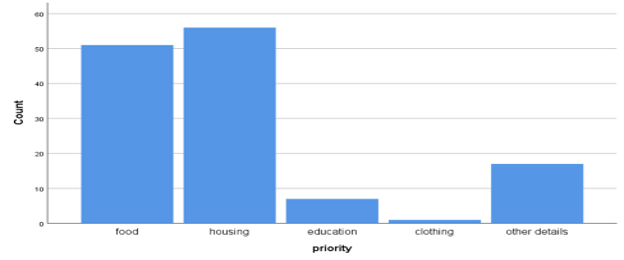
Figure 26 showing if they receive cash assistance, what would use it for in priority for Adult
Figure26: show that 38.6% of the respondents’ interviews use their cash assistance on food for adults, 42.4% on housing, 5.3% on education, 0.8% on clothing, and 12.9% on others like a business.
If you were to receive cash assistance, what would you use it for in priority for children?
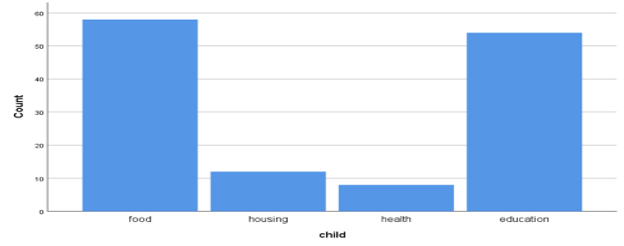
Figure 27 showing if they receive cash assistance, what would use it for in priority for children
Figure26: show that 43.9% of the respondent interview use their cash assistance on food for adult, 9.1% on housing, 40.9% on education and 6.1% on health
1.7 Child protection and Recovery awareness
Do you know what child protection is
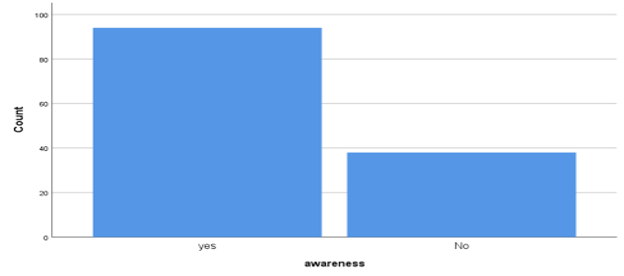
Figure 28: showing the level of awareness on child protection
Figure23: show that 71.2% of the respondent interviewed said yes know what child protection is and 28.8% said No
What are the major risks you children are currently facing?
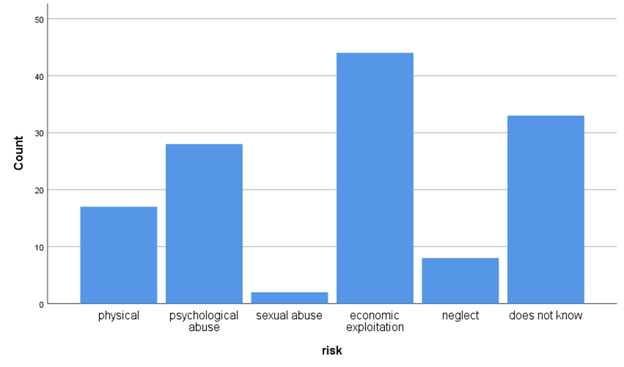
Figure 29: showing the major risk their children are currently facing
Figure29: show that 12.9% of the respondent interviewed said their children are physical abuse, 21.2% psychological abuse, 1.5% sexual abuse, 33.3% economic exploitation, 6.1% neglect and 25.0% do not know
Figure 30: beneficiaries’ overall level of satisfaction
Figure 30: the data clearly stated that the respondent household head interviewed were totally satisfied.
Conclusion and recommendations
Conclusion
Based on the findings of the study, the following conclusions are drawn:
Female households dominate as the most vulnerable people in the study area, indicating that women play an essential rule in the sustainability of the house.
The majority of the household head were within the age bracket of 25 to 59 years, stating that there are more active members engaged in supporting the livelihood for each household. It also stated clearly that most of the household was led by a single woman and the situation of children in the household categorical sate that for the school level most of the children are in primary school and in good health condition they also need protection.
The data also stated clearly that all the targeted beneficiaries were affected by the flood/landslide and their properties are destroyed.
The data also shows that before the landslide they have income-generating activities but now it was destroyed activity.
The majority of the household head know what is child protection and most of them stated that the major risks their children are currently facing are economic exploitation.
According to the data collected the household head were totally satisfied
Recommendations
After the conclusion drawn from the study, the following are some of the recommendations:
- The study recommends that for any implementation of such a project there should be an early collaboration with government officials to avoid time-wasting
- According to what revealed there should be a continues to follow up to our beneficiaries more especially the children that we did the family tracing and reunification for.
- The government should enforce that the beneficiary list should be available on time
References
Unicef,21 August 2017.Sierra Leone flood and landslide situation report NO.4
SOS children village – Sierra leone, September 2017, ensuring the essential needs of vulnerable crises affected household pp1
Sierra Leone – Rapid damage and loss assessment of August 14th, 2017 landslides and floods in the western area (English)
AGAPS,16 August 2017, Sierra Leone Mudslide and flooding in Greater Freetown
WANEP,15 August 2017, The Sierra Leone Mudslides and Floods: Implication to Human Security


![Debunking-the-Taboos-of-Eating-Pork-[Part-1]](https://www.acowas.com/wp-content/uploads/2019/11/Debunking-the-Taboos-of-Eating-Pork-Part-1.jpg)